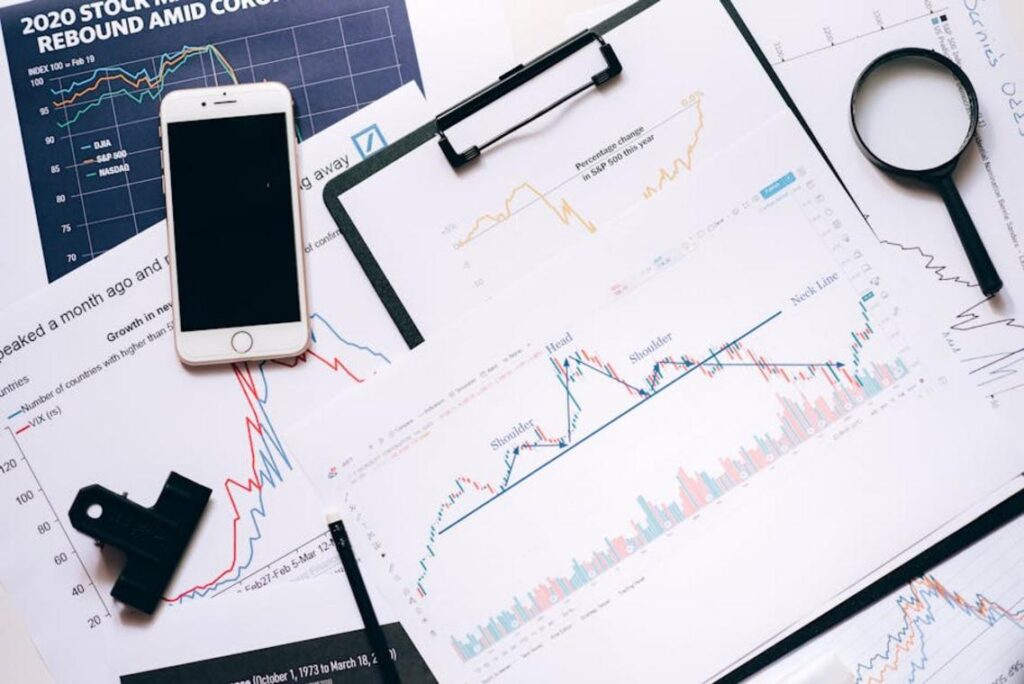
Financial markets are shifting fast—and if you’re trying to make sense of where capital is flowing next, you’re not alone. Investors today are navigating volatile Inflation data, changing Interest Rates, fluctuating GDP growth, and mixed signals from the S&P 500. At the same time, on-chain activity and liquidity cycles are creating new opportunities that traditional analysis often overlooks.
This article breaks down the core economic indicators and capital flow patterns shaping today’s landscape. You’ll gain clarity on how macro fundamentals connect with market behavior, how to interpret signals like CPI and central bank policy shifts, and how to position your strategy accordingly.
Our insights are grounded in data-driven research, on-chain modeling, and rigorous analysis of global capital movements—not speculation. If you’re looking for a clear, structured understanding of current financial trends and practical guidance for wealth planning, you’re in the right place.
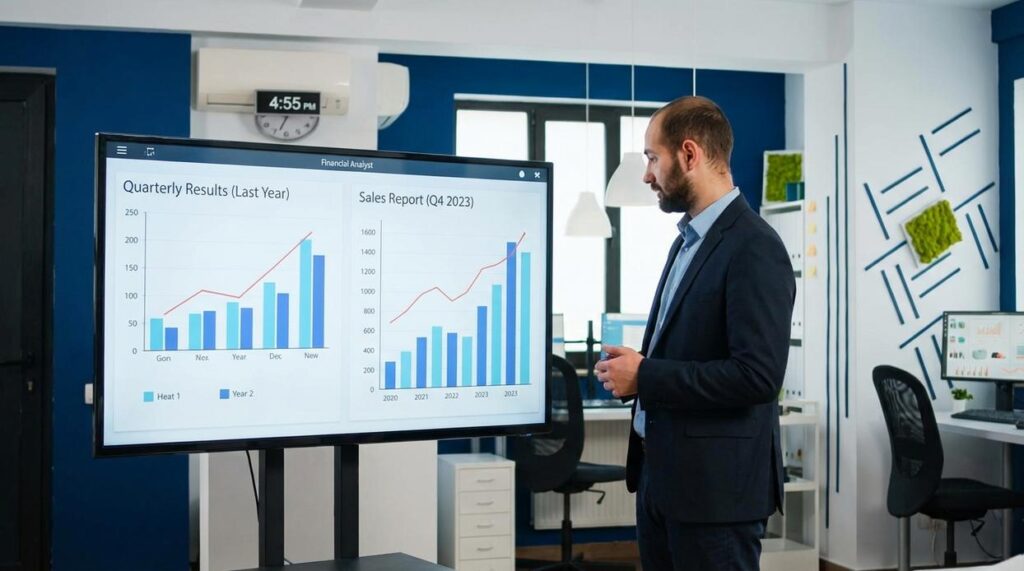
Markets generate endless data, yet clarity comes from focus. I believe most investors overcomplicate analysis, chasing headlines instead of signals. Instead, start with a tight dashboard of financial market indicators that reveal trend, momentum, and liquidity.
Consider this simple framework:
| Indicator | What It Shows | Why It Matters |
| Trend (Moving Averages) | Direction | Confirms bias |
| CPI | Inflation | Shapes rates |
| Volume | Participation | Validates moves |
However, no single metric wins alone. Combine macro data with price action; then, adjust when liquidity shifts. In my view, disciplined synthesis beats prediction every time. Still, patience and risk management remain your ultimate edge. Trust process over noise.
Anticipating Economic Shifts: Key Leading Indicators
Economies rarely shout before they turn—they whisper. That’s where leading indicators come in. These are forward-looking data points that tend to move before the broader economy does, offering clues about what might happen next (think of them as the trailer before the blockbuster).
Indicator 1: ISM Manufacturing Index (PMI)
The ISM Manufacturing Index (PMI) measures purchasing managers’ activity across new orders, production, employment, and supplier deliveries. A reading above 50 signals expansion; below 50 suggests contraction. Because manufacturers adjust quickly to demand shifts, PMI often predicts GDP growth and corporate earnings trends. When factories hum, profits often follow.
Indicator 2: Consumer Confidence Index (CCI)
The Consumer Confidence Index (CCI) surveys how optimistic households feel about income, jobs, and business conditions. Since consumer spending drives roughly two-thirds of U.S. economic activity (U.S. Bureau of Economic Analysis), rising confidence can foreshadow stronger retail sales. When confidence dips, it’s less “YOLO shopping spree” and more budget spreadsheet.
Indicator 3: Building Permits
Building permits measure approved new construction projects. An increase typically precedes growth in housing, materials, and employment. Housing is often the economy’s early heartbeat—when permits rise, broader momentum may follow.
Confirming Market Realities: The Role of Lagging Indicators

Lagging indicators are the economy’s rearview mirror. They shift after momentum has already changed, helping analysts confirm whether a perceived move is real or just noise. While many investors chase leading signals, the smarter question is: has the trend actually stuck?
Take the Unemployment Rate. It’s considered lagging because businesses rarely hire or fire based on a single weak quarter. They wait. Only when revenue declines persist do staffing cuts occur. By the time unemployment rises, the slowdown is already embedded in corporate balance sheets. Critics argue this makes it useless for positioning. But that misses the point—it validates whether labor weakness is structural, not temporary.
Then there’s the Consumer Price Index (CPI). CPI tracks the average change in prices consumers pay for goods and services, confirming inflation that households are already experiencing. Yes, markets often anticipate inflation before CPI prints. However, central banks anchor policy decisions to confirmed data, not speculation. That confirmation drives rate adjustments and liquidity conditions.
Used correctly, lagging financial market indicators:
- Confirm durable shifts in growth or contraction
- Validate capital rotation strategies
- Reduce false positives from premature forecasts
They don’t predict. They prove. And in volatile cycles, proof is power.
Reading the Charts: Essential Technical Analysis Indicators
Technical indicators use price and volume data to forecast potential moves. In simple terms, they translate raw market noise into structured signals. Among the most widely used financial market indicators are Moving Averages, RSI, and MACD. Each answers a different question—trend, momentum, or both.
Moving Averages (SMA vs. EMA)
A Moving Average (MA) smooths price data to reveal direction. The Simple Moving Average (SMA) calculates an average over a set period, while the Exponential Moving Average (EMA) gives more weight to recent prices. Think of SMA as a steady cruise control and EMA as a sports mode—more responsive but sometimes jumpy.
When the 50-day MA crosses above the 200-day MA (a “golden cross”), traders often interpret it as bullish. The opposite, a “death cross,” suggests weakness. Critics argue crossovers lag because they rely on past data—and they’re right. However, for long-term investors, lag can filter out short-term noise.
Relative Strength Index (RSI)
RSI measures momentum on a 0–100 scale. Traditionally, above 70 signals overbought conditions, while below 30 signals oversold. Yet in strong trends, RSI can stay elevated or depressed for weeks (just ask anyone who shorted a runaway rally). Used alone, it misleads; paired with trend analysis, it sharpens timing.
MACD
MACD blends trend and momentum. It consists of the MACD line, signal line, and histogram. When the MACD line crosses above the signal line, momentum may be turning bullish. Compared side-by-side with RSI, MACD is slower but often more reliable in sustained trends.
For broader context, review (https://ontpeconomy.com.co/a-beginners-guide-to-reading-financial-trend-reports/).
The Modern Edge isn’t found on price charts alone. It’s revealed by following where money actually moves. Capital flows—the movement of funds into or out of sectors, ETFs, or asset classes—act as real-time conviction signals. When you see large, sustained inflows, that often reflects institutional positioning before performance headlines catch up. In other words, follow the capital, not the commentary.
For digital assets, on-chain models add another layer. Because blockchains are transparent, you can monitor exchange reserves or whale wallet activity—large holders capable of shifting supply. Declining exchange balances may signal tightening supply, while sudden inflows can hint at selling pressure.
Admittedly, critics argue that flows lag price. Sometimes they do. However, combining them with traditional financial market indicators creates a behavioral edge. My recommendation: track weekly fund flow reports and on-chain dashboards, then act when both align. That’s where probability—not hype—tilts in your favor. Consistency compounds over time.
Building a Cohesive Analytical Toolkit
You now understand the key categories of financial market indicators and how each frames price action differently. However, the edge comes from synthesis, not obsession over a single chart line. Some traders argue one trusted signal is enough. Yet markets are complex systems; confirmation across tools reduces blind spots.
So what’s next?
Start by choosing one leading, one lagging, one technical, and one capital-flow metric. Then, track them weekly and journal how signals converge or conflict with market performance. Over time, patterns emerge—and so will your confidence. Pro tip: review quarterly to refine wealth plans.
Position Yourself Ahead of the Next Market Shift
You came here looking for clarity in a market that often feels unpredictable and overwhelming. Now you have a stronger understanding of the financial trends, economic fundamentals, and capital flow strategies shaping today’s landscape.
Uncertainty is costly. Missed signals, poor timing, and emotional decisions can quietly erode wealth. By applying on-chain models, tracking capital movement, and focusing on disciplined wealth planning, you reduce risk and position yourself for smarter, data-driven growth.
The next step is simple: put this knowledge into action. Start reviewing current market indicators, refine your allocation strategy, and commit to consistent analysis instead of reactive decisions. The investors who win are the ones who act early and act informed.
If you’re serious about building durable wealth and navigating volatility with confidence, now is the time to go deeper. Explore more advanced insights, sharpen your strategy, and take control of your financial future today.
 Founder & Chief Executive Officer (CEO)
Elryssa Meldraina has opinions about capital flow strategies. Informed ones, backed by real experience — but opinions nonetheless, and they doesn't try to disguise them as neutral observation. They thinks a lot of what gets written about Capital Flow Strategies, Expert Tutorials, Financial Trends Tracker is either too cautious to be useful or too confident to be credible, and they's work tends to sit deliberately in the space between those two failure modes.
Reading Elryssa's pieces, you get the sense of someone who has thought about this stuff seriously and arrived at actual conclusions — not just collected a range of perspectives and declined to pick one. That can be uncomfortable when they lands on something you disagree with. It's also why the writing is worth engaging with. Elryssa isn't interested in telling people what they want to hear. They is interested in telling them what they actually thinks, with enough reasoning behind it that you can push back if you want to. That kind of intellectual honesty is rarer than it should be.
What Elryssa is best at is the moment when a familiar topic reveals something unexpected — when the conventional wisdom turns out to be slightly off, or when a small shift in framing changes everything. They finds those moments consistently, which is why they's work tends to generate real discussion rather than just passive agreement.
Founder & Chief Executive Officer (CEO)
Elryssa Meldraina has opinions about capital flow strategies. Informed ones, backed by real experience — but opinions nonetheless, and they doesn't try to disguise them as neutral observation. They thinks a lot of what gets written about Capital Flow Strategies, Expert Tutorials, Financial Trends Tracker is either too cautious to be useful or too confident to be credible, and they's work tends to sit deliberately in the space between those two failure modes.
Reading Elryssa's pieces, you get the sense of someone who has thought about this stuff seriously and arrived at actual conclusions — not just collected a range of perspectives and declined to pick one. That can be uncomfortable when they lands on something you disagree with. It's also why the writing is worth engaging with. Elryssa isn't interested in telling people what they want to hear. They is interested in telling them what they actually thinks, with enough reasoning behind it that you can push back if you want to. That kind of intellectual honesty is rarer than it should be.
What Elryssa is best at is the moment when a familiar topic reveals something unexpected — when the conventional wisdom turns out to be slightly off, or when a small shift in framing changes everything. They finds those moments consistently, which is why they's work tends to generate real discussion rather than just passive agreement.